
Ripple started a major decline below the $0.4200 and $0.4000 support levels against the US Dollar. XRP price is gaining momentum, but approaching the key 100-day simple moving average and $0.3200.
- Ripple started a strong decline from well above $0.5000 against the US dollar after SEC’s threat.
- The price is now trading well below $0.4000, and approaching the 100-day simple moving average.
- There was a break below a major declining channel with support near $0.4000 on the daily chart of the XRP/USD pair (data source from Kraken).
- The pair is likely to find a strong buying interest near the $0.3250 and $0.3150 levels.
Ripple’s XRP Price is Down 25%
After SEC’s threat, ripple’s XRP price started a strong decline from well above the $0.5000 level. The price is down over 25% and it broke many supports such as $0.4500 and $0.4000.
The price even settled below $0.4000 to move further into a bearish zone. There was a break below the 50% Fib retracement level of the main upward move from the $0.2270 swing low to $0.7853 high. Moreover, there was a break below a major declining channel with support near $0.4000 on the daily chart of the XRP/USD pair.
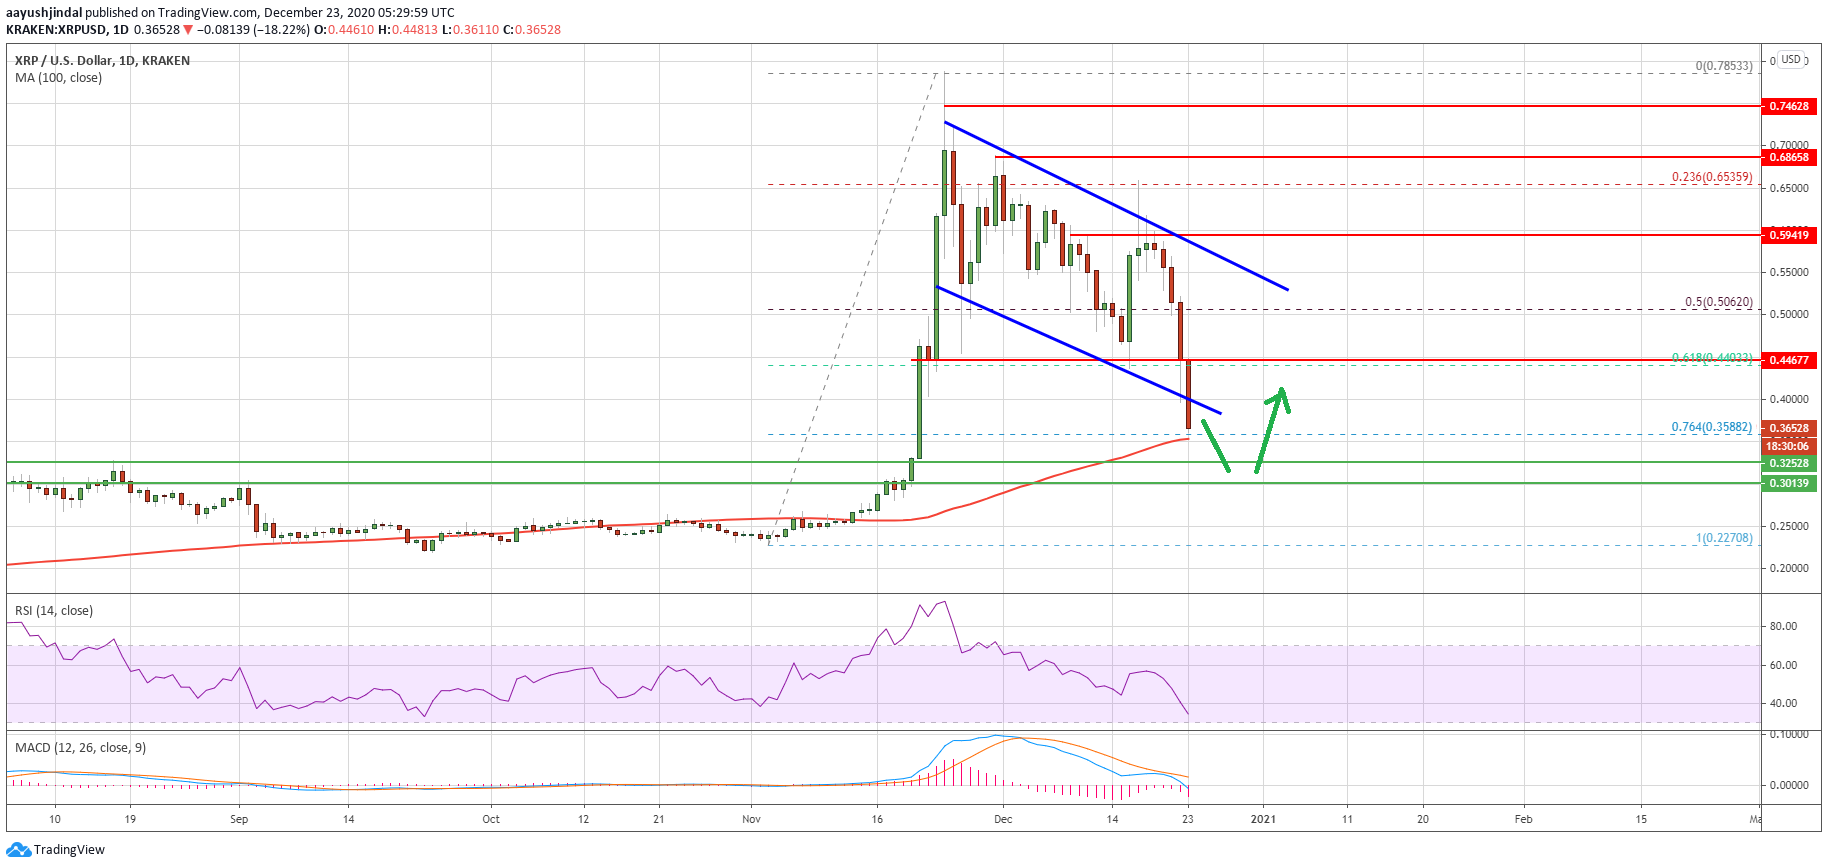
Source: XRPUSD on TradingView.com
XRP price is now trading well below the $0.3800 level. It is now approaching the $0.3400 support zone and the 100-day simple moving average.
The 76.4% Fib retracement level of the main upward move from the $0.2270 swing low to $0.7853 high is also near the $0.3580 level. The next major support is near the $0.3250 level, followed by $0.3000.
A close below the $0.3000 support zone could easily drift the market towards the $0.2650 and $0.2500 support levels in the coming days.
Upsides Capped in XRP?
If ripple starts a recovery wave, it could face a lot of hurdles, starting with the broken channel trend line at $0.3850. The first major resistance for the bulls is near the $0.4000 level.
The main resistance is now forming near the $0.4450 level. A close above the $0.4000 and $0.4500 levels could pull the price out of the bearish zone. If not, it is likely to extend losses below $0.3500.
Technical Indicators
Daily MACD – The MACD for XRP/USD is gaining momentum in the bearish zone.
Daily RSI (Relative Strength Index) – The RSI for XRP/USD is now well below the 50 level.
Major Support Levels – $0.3250, $0.3000 and $0.2500.
Major Resistance Levels – $0.3850, $0.4000 and $0.4500.