It’s been a two-faced session in the cryptocurrency segment, as the most valuable coin drifted lower in a choppy fashion, while several major altcoins posted lofty gains amid the capital rotation before turning lower in late trading. The total value of the market is still above the $600 billion mark, and BTC us holding up right at $300 billion.
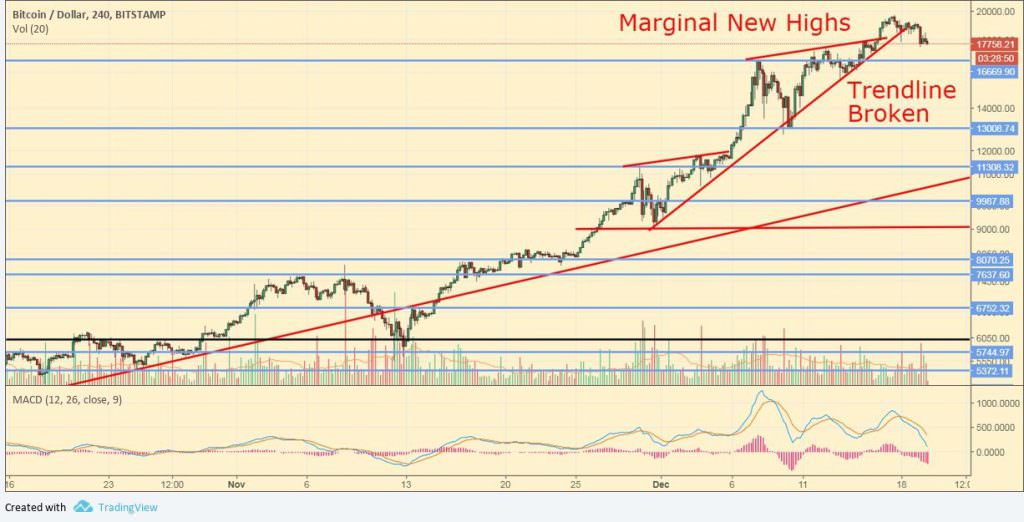
Bitcoin is still not far off its all-time high, with a 10% correction so far, which left the long-term setup unchanged but brought the short-term momentum back to neutral territory. The coin is now clearly below the short-term uptrend line, and given the still overbought long-term picture, a deeper correction remains likely. Strong support is only found at $13,000 with further levels at $11,300, $10,000, $9000, while stronger levels are near $8200 and $7700.
BTC/USD, 4-Hour Chart Analysis
Litecoin was one of the strongest majors, crossing the $20 billion in market cap while hitting a marginal new all-time high, as we assumed yesterday. The coin is trading near the $350 after the recent correction and it remains stretched regarding the long-term picture, and long-term investors shouldn’t jump in the market here, as a deep correction is likely in the coming weeks, although traders could still hold smaller positions speculating on another push to new highs. Key support levels are still found at $125 and $100, with weaker levels between $250 and $260 and at $170.

LTC/USD, 4-Hour Chart Analysis
Ethereum

ETH/USD, 4-Hour Chart Analysis
Ethereum continued to drift higher to new all-time highs today, following the recent break-out above the range around the range extension target. The coin topped $800 thanks to today’s rally, and re-tested the lower boundary of the previous rising trend channel. We expect a significant move lower as the long-term momentum remains severely overbought, with initial support at $740, and key levels now found at $575, between $480 and $500, and near the prior all-time high at $400.
Dash

DASH/USD, 4-Hour Chart Analysis
Dash is testing its recent all-time highs, although it failed to rise above the weekend top despite the bullish sentiment. The prior dominant short-term uptrend is still broken, and the coin remains on a long-term sell signal, with the elevated correction risks still being present.Major support levels are now found at $800, $650, $600, $500, and near $410.
Ripple

XRP/USD, 4-Hour Chart Analysis
Ripple topped out near its break-out high today, and the coin failed to build on the altcoin rally after its recent stellar gains and the long-term sell signal that has been triggered last week. The coin will likely re-test its prior all-time high during the next correction, with initial support now found at $0.68, while further levels at $0.4250 and in the $0.30-$0.32 range.
Ethereum Classic

ETC/USD, 4-Hour Chart Analysis
Ethereum Classic kept on grinding higher along the lower boundary of its previous trend channel and the coin reached the $40 level before turning lower today. We expect the coin to enter a deep correction together with the other majors in the coming period, with another likely test of the previous high at $23. Above that zone, support is found at $32 and $30 while a further strong is at $18.
Monero

XMR/USD, 4-Hour Chart Analysis
Monero got close to the $400 level as it remained among the strongest majors as it continued to trade in its dominant short-term uptrend, despite the momentum divergence that we noted yesterday. That said, the long-term setup remains unchanged and investors should wait for the next correction before entering new positions. Key support levels are now found at $300, $240, $200, $180, and $150.
NEO

NEO/USDT, 4-Hour Chart Analysis
NEO entered a short-term correction today as we expected after reaching overbought readings on the 4-hour chart following the recent break-out. The coin remains less stretched regarding the long-term picture than the other majors, but a segment-wide correction will likely drag the NEO down as well. Key support levels are now found at $0.56, $0.50 and $0.40, while the range extension target is ahead at $100.
IOTA

IOTA/USD, 4-Hour Chart Analysis
IOTA tested its all-time high today as it broke out from the consolidation pattern that developed after the recent exponential surge. We still expect the correction to continue after the re-test, as the long-term setup remains unchanged. Strong support is still only found at $3 and $1.5, with potential Fibonacci support at $2.35.
Featured image from Shutterstock
Disclaimer: The analyst owns cryptocurrencies. He holds investment positions in the coins, but doesn’t engage in short-term or day-trading, nor does he hold short positions on any of the coins.