
The Cardano price continued to depict a strong bearish influence in the market. The coin lost over 7% of its value over the last 24 hours. On a weekly time frame, ADA was down by 14%. The extended price pullback might continue, so investors should be wary of their next move.
The ADA price was unsettled; the only way investors can make gains is to sell now and buy when the coin dips further, as it would recover lost gains by correcting itself. The technical outlook for the coin supported the bearish thesis and emphasized that ADA might nosedive below its local support line.
The trading volume of Cardano also dipped, indicating that sellers have taken over the market. In case of a price correction, if ADA manages to move above the $0.30 price mark, then the bulls will make a comeback. If bearish momentum continues to prevail, then investors will be presented with a shorting opportunity.
Cardano Price Analysis: One-Day Chart
ADA was trading at $0.26 at the time of writing. The altcoin continues to remain slippery ever since it lost the $0.44 support line. As accumulation remained considerably low on the chart, there are chances that the token’s value will drop further.
Overhead resistance for the coin stood at $0.28 and then at $0.29. There will be rigid resistance at the $0.30 mark. In the event of the price falling further, the first stop would be at $0.24 and then at $0.22. The amount of ADA traded in the last session declined, indicating a fall in demand for the altcoin.
Technical Analysis
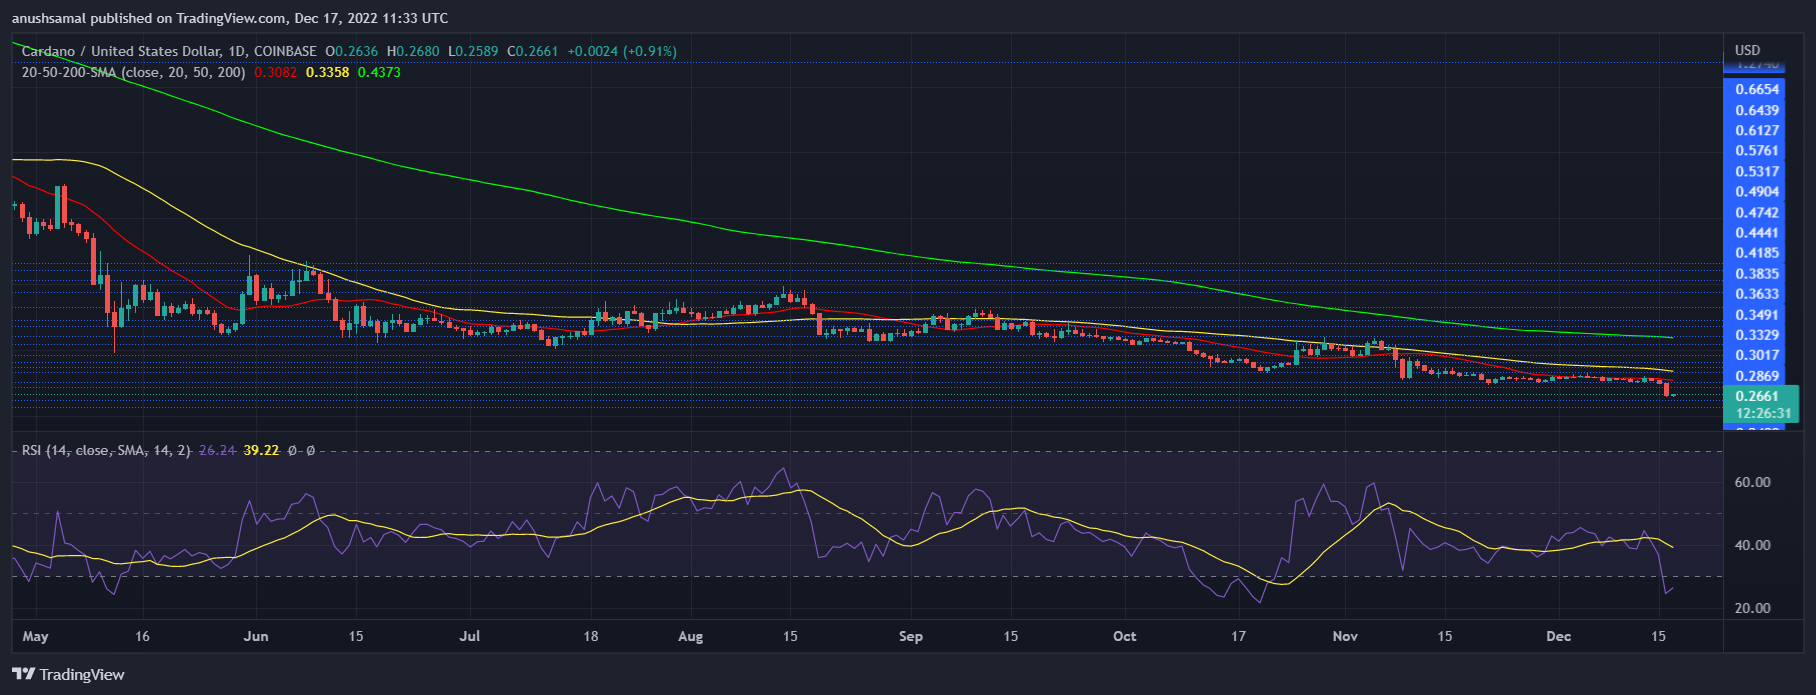
The altcoin has remained in seller territory for most of November and all of this month. Confirming that, the Relative Strength Index was parked underneath the 20-mark. This was a sign of overselling, indicating that the altcoin was heavily undervalued.
ADA dipped below the 20-Simple Moving Average line, and that meant lowered demand. It also depicted that the sellers were driving the price momentum in the market.
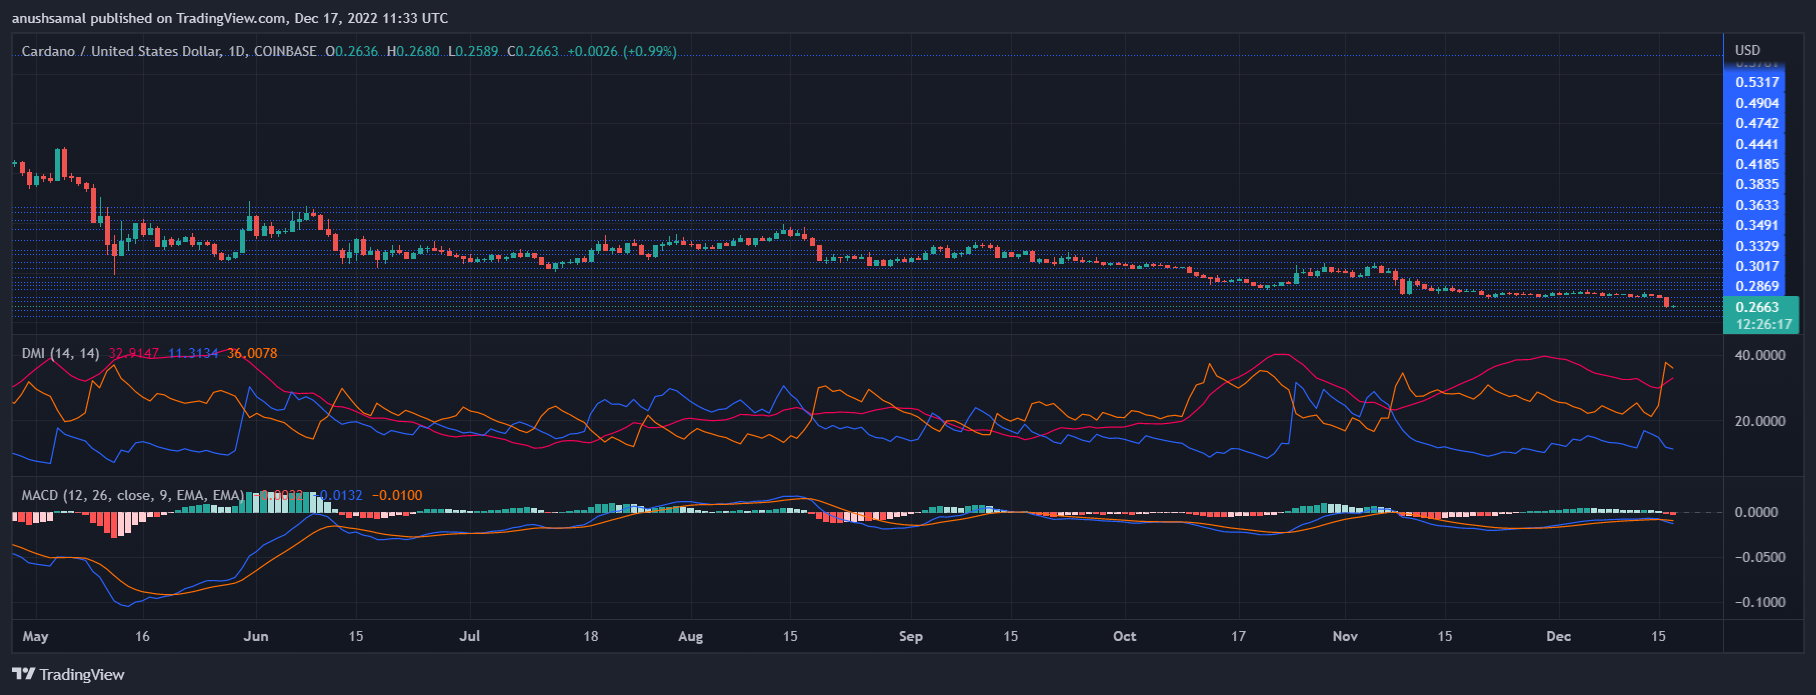
In accordance with the other technical indicators, the coin formed a sell signal on its daily chart. This would point to a shorting opportunity for investors in order to make up for the loss they incurred. The Moving Average Convergence underwent a bearish crossover and formed a red signal bar, which was the sell signal for the altcoin.
MACD reads the price momentum, and the indicator agrees with the bears. The Directional Movement Index portrays the price direction. DMI was negative as -DI (orange) was above the +DI (blue) line. The Average Directional Index (red) was up and above the 20-mark, meaning that bearish price action is gaining strength.